|
性行為的發展
|
|
性行為的發展概述
|
|
生命起伏之说 |
|
當我們試圖解釋人的性行為發展的時候,必須切記每一個生命體的獨特個性。
再重複一遍,當要說起一個生命體的誕生、成熟、衰老和終結的時候,確實並不意味著這是一個簡單的輪回過程。至多,她可能提示著一個起伏的過程,並且只有把體力和性能力作為指標的時候才能這麼認為。可是,諸如愛的能力和體驗快樂的能力這些另外的評判指標又該如何呢?可能會出現伏起(先低後升)的特徵——穩步上升並隨著個體的死亡而最終嘎然而止。
無論如何,我們必須防止未經努力而圖省事的比較。不能把我們在這裏解釋的性行為的發展過程錯誤地理解成每一個人所具有的一個標準或一種定式。可是,有病的人或健康不佳的人的性行為發展就會偏離這種模式。人的性行為是如此之複雜和種類如此之繁雜,以至於對它的任何解釋可能只不過是一種很不精確的概括而已。雖然如此,這種解釋至少可以幫助我們理解我們自己的某些性行為發展的基本實情。
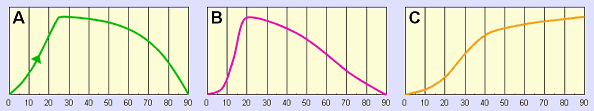
A.
個體生命發展[1]:這條曲線表示人從誕生到成熟、衰老和死亡的典型的個體生命發展過程。數字是指每生存10年。此處,就像隨後的曲線一樣,假定一個人相當地長壽。
B.
性能力:這條曲線表示男性從誕生經過青春期和成年期到老年期的性能力的平均值。請注意這段逐漸斜行隨後于成年早期達到峰值的曲線。C.
體驗快樂能力:這條曲線表示人的愛與體驗快樂的可能能力。請注意這段穩步上升直到死亡的曲線特徵。
A. Biological development. The curve represents the typical human biological development from birth to maturity, decline, and death. The numbers refer to decades of life. In this, as in the following graphs, a rather long life is assumed. B. Sexual capacity. The curve represents the average male sexual capacity from birth through puberty and adulthood to old age. Note the gradual decline after the peak in early adulthood. C. Capacity for happiness. The curve represents the possible human capacity for love and happiness. Note the steady rise until death.
|
Development of Sexual Behavior |
|
Introduction
|
|
A Curve? |
The unique character of each human life also has to be kept in mind when one tries to describe human sexual development.
Again, one may speak of a beginning, of maturation, decline and an ending, but this does not imply a cycle. At most, it may suggest a rising and falling curve, and this only if physical strength and sexual capacity are used as the only criteria. However, another criterion, such as the capacity to love and to experience happiness, could produce a very different curve - steadily rising and finally abruptly ending with the person’s death.
In any case, we have to guard against facile comparisons. The sexual development we describe here is not to be misunderstood as a norm, binding for everyone. It is not a pattern from which only sick or bad people deviate. Human sexual behavior is so complex and varied that any description of it can be nothing more than a vague generalization. Even so, it can help us understand at least some basic facts about ourselves.
 |
A. Biological development. The curve represents the typical human biological development from birth to maturity, decline, and death. The numbers refer to decades of life. In this, as in the following graphs, a rather long life is assumed. B. Sexual capacity. The curve represents the average male sexual capacity from birth through puberty and adulthood to old age. Note the gradual decline after the peak in early adulthood. C. Capacity for happiness. The curve represents the possible human capacity for love and happiness. Note the steady rise until death. |
|