National Health Statistics Reports
Number 36, March 2011
Sexual Behavior, Sexual Attraction, and Sexual Identity in the
United States:
Data from the 2006-2008 National Survey of Family Growth
By Anjani Chandra, PhD, William D. Mosher, PhD, and Casey Copen, PhD, Division of Vital Statistics, CDC/NCHS; Catlainn Sionean, PhD, Division of HIV/AIDS Prevention, CDC/NCHHSTP
A reformatted, typeset version of this report will replace the current version.
Abstract
Objective: This report presents national estimates of several measures of sexual behavior, sexual attraction, and sexual identity among males and females 15-44 years of age in the United States, based on the 2006-2008 National Survey of Family Growth (NSFG). These data are relevant to demographic and public health concerns, including fertility and sexually transmitted diseases among teenagers and adults. Data from the 2006-2008 NSFG are compared with data from the 2002 NSFG and other national surveys.
Methods: Data for 2006-2008 were collected through in-person interviews with a national sample of 13,495 males and females in the household population of the United States. The measures presented in this report were collected using Audio Computer-Assisted Self-Interviewing (ACASI), in which the respondent enters his or her own answers into the computer without telling them to an interviewer. The response rate for the 2006-2008 NSFG was 75%.
Results: Sexual behaviors among males and females 15-44 years of age, based on the 2006-2008 NSFG, were generally similar to those reported based on the 2002 NSFG. Among adults 25-44, about 98% of females and 97% of males ever had vaginal intercourse, 89% of females and 90% of males ever had oral sex with an opposite-sex partner, and 36% of females and 44% of males ever had anal sex with an opposite-sex partner. Twice as many women reported any same-sex contact in their lifetimes compared with men (13% of women and 5.2% of men). Among teenagers aged 15-19, 7% of females and 9% of males have had oral sex with an opposite-sex partner, but no vaginal intercourse. Sexual attraction and identity correlates closely but not completely with reports of sexual behavior. Sexual behaviors, attraction, and identity vary by age, marital and cohabiting status, education, race and Hispanic origin.
Keywords: Sexual behavior; oral sex; sexual orientation; National Survey of Family Growth
Introduction
This report presents national estimates of several types of sexual behavior among men and women 15-44 years of age in the United States in 2006-2008, as well as measures of sexual attraction and identity for adults 18-44. These behaviors and characteristics are relevant to birth and pregnancy rates, as well as the incidence of sexually transmitted infections (STIs), including human immunodeficiency virus (HIV), the virus that causes acquired immune deficiency syndrome (AIDS) (1-3). The Centers for Disease Control and Prevention (CDC) estimates that about 19 million new cases of STIs occur each year (2). About half of all STIs occur among persons 15-24 years of age, and the direct medical cost of these diseases to 15-24 year olds alone was estimated at $6.5 billion in the year 2000 (4). In 2008, CDC estimated that rates of Chlamydia increased, and the largest numbers of reported cases of Chlamydia and gonorrhea were among teenagers ages 15-19 (5). These recent data also suggest there were significant racial disparities in the rates of reportable STIs in the United States in 2008, particularly among teens and young adults. Among women, black teens ages 15-19 had the highest rates of Chlamydia and gonorrhea, followed by black females ages 20-24 (5).
With regard to HIV/AIDS, approximately 50,000 Americans are diagnosed with HIV infection each year (6), and over one million Americans are currently living with HIV (1). Although current HIV medications have substantially increased life expectancy (7), the medical costs are substantial, averaging approximately $20,000 per year for each person in care (8). These infections not only affect the HIV-positive individuals, but may also be transmitted to spouses and partners, and among pregnant women, to their babies. Data for HIV/AIDS cases (in 37 states with confidential name-based reporting) in 2008 suggest that 54 percent of HIV cases diagnosed in 2008 were transmitted by same-sex sexual contact among males, and another 32 percent by heterosexual sexual contact. Therefore, approximately 86 percent of HIV cases were acquired through sexual behavior (1).
A previous report on sexual behavior and selected health measures used data from the 2002 NSFG to present national estimates of some basic statistics on certain types of sexual behavior, sexual identity, and sexual attraction in the United States that have public health significance (9). The current report contains more recent data from the 2006-2008 NSFG on the following topics:
• Numbers of opposite-sex sexual partners in the past year and in lifetime for persons 1544 (tables 1-4)
• Types of sexual behavior (including opposite-sex and same-sex partners) among persons 15-44 (tables 5-6, figure 1)
• Types of sexual behavior (including opposite-sex and same-sex partners) among persons
15-24 (tables 7-8, figure 2)
• Numbers of sexual partners (opposite-sex and same-sex) in the past year among persons
15-44 (table 9)
• Same-sex sexual activity among persons 15-44 (table 10)
• Sexual attraction and identity among persons 18-44 (tables 11-13)
• Association of sexual behavior, sexual attraction, and sexual identity (tables 14-15)
Improvements were made in some of the questions in the NSFG and some new items have been collected on these topics to improve the utility of the data. Comparisons with Cycle 6 (2002)
NSFG and other national surveys (table 16) are made to the extent possible to shed light on the reliability of the results and to suggest whether any marked trends have occurred.
Selected Previous Studies
In addition to the NSFG, several nationally representative studies of sexual behavior have been conducted in the United States in the last two decades. These surveys were based on in-person interviews and used national probability samples. These include:
• the National Survey of Men (10-11), conducted in 1991 with 3,321 men 20-39 years of
age;
• the National Health and Social Life Survey (NHSLS), conducted in 1992 with 3,432 men and women 18-59 years of age (12-13); and
• the General Social Survey, which has included some questions on sexual behavior in its national samples of adults 18 and older since 1988 (14-17).
In addition, some surveys limited to teenagers have collected data on some aspects of sexual behavior, including the CDC's Youth Risk Behavior Survey, a biennial school-based survey of high school students, which included data on condom use, sexual intercourse, and numbers of sexual partners (18). The Urban Institute's National Surveys of Adolescent Males collected data on the sexual activity and contraceptive use of national samples of males 15-19 years of age in 1988 and 1995 (19). In 2009, researchers at Indiana University conducted an internet-based study of sexual behaviors among adolescents and adults, called the National Survey of Sexual Health and Behavior (NSSHB). The NSSHB asked about behaviors in a sample of 5,865 men and women ages 14-94 (20). Other national studies that examined sexual behaviors in the general population are referenced in our previous report on sexual behavior (9).
Methods
Data Source
The National Survey of Family Growth (NSFG) has been conducted 7 times by NCHS: in 1973 and 1976 with samples of married and formerly married women; in 1982, 1988, and 1995, with samples of women of all marital status categories; and in 2002 and 2006-2010 with national samples of both women and men 15-44 years of age. Each time, the interviews have been conducted in person by trained female interviewers in the selected persons' homes. The current report is based on the first data release from the 2006-2010 NSFG, specifically those interviews conducted from June 2006 through December 2008, and referred to as the 2006-2008 NSFG. The 2006-2008 NSFG is a nationally representative multi-stage probability sample drawn from 85 areas across the United States. The sample is designed to produce national, not state, estimates. Large areas (counties and cities) were chosen first; within each large area or "Primary Sampling Unit," groups of adjacent blocks, called segments, were chosen at random. In each segment, addresses were listed and some addresses were sampled at random. The sampled addresses were visited in person, and a short "screener" interview was conducted to see if anyone 15-44 lived there. If so, one person was chosen at random for the interview and was offered a chance to participate. To protect the respondent's privacy, only one person was
interviewed in each selected household. In 2006-2008, as well as in 2002, teenagers and black and Hispanic adults were sampled at higher rates than others. The final sample for 2006-2008 consisted of 13,495 respondents aged 15-44 - 7,356 females and 6,139 males.
All respondents were given written and oral information about the survey and were informed that participation was voluntary. Adult respondents 18-44 years of age were asked to sign a consent form but were not required to do so. For minors 15-17 years of age, signed consent was required first from a parent or guardian, and then signed assent was required from the minor; if either the parent or the minor declined to give written consent, the minor did not participate in the survey. Respondents were assured that the confidentiality of their information would be protected. The response rate for the 2006-2008 NSFG was 75 percent overall—76 percent for women and 73 percent for men.
Over the course of fieldwork in 2006-2010, about 100 female interviewers were hired and trained by the survey contractor, the University of Michigan's Institute for Social Research, under the supervision of NCHS. At any given point in the data collection period, 40-45 interviewers were in the field conducting NSFG interviews. Respondents in the 2006-2010 survey were offered $40 as a "token of appreciation" for their participation. The NSFG questionnaires and materials were reviewed and approved by both the CDC/NCHS Research Ethics Review Board and the University of Michigan Institutional Review Board. The female questionnaire lasted an average of about 80 minutes and the male questionnaire lasted about 60 minutes.
More detailed information about the methods and procedures of the NSFG and its sample design, weighting, imputation and variance estimation has been published (21-22). Results of the 2006-2008 NSFG on the heterosexual activity, contraceptive use, and childbearing experience of American teenagers (23), and the contraceptive use of women 15-44 years of age (24), have also been published. Forthcoming reports will show national estimates of HIV risk and testing for men and women 15-44 years of age, similar to what was published from the 2002 NSFG (25-26).
Use of ACASI
Much of the data in the survey were collected by Computer-Assisted Personal Interviewing, or CAPI, in which the questionnaire was stored on a laptop computer, and administered by an interviewer, but many of the variables described in this report were collected using Audio Computer-Assisted Self Interviewing (ACASI). The ACASI portion of the NSFG interview was significantly expanded for the 2002 and 2006-2010 surveys in response to the need for reliable, general population-based, national data on sexual and drug behavior related to HIV/AIDS and other STIs, as well as data on sexual identity measures (25, 27-29). The staff of the NSFG worked with the CDC's Division of HIV/AIDS Prevention, other collaborating agencies, and experts who had conducted surveys on closely related topics (10-14), to develop appropriate questions for this purpose. In ACASI the respondent listens to the questions through headphones, reads them on the screen, or both, and enters the response directly into the computer. This method avoids asking the respondent to give his or her answers to the interviewer, and it has been found to yield more complete reporting of sensitive behaviors (30). ACASI may also make it possible for persons with lower literacy to complete the self interview
by listening to the questions instead of reading them. All data on sexual behavior shown in this report were collected using ACASI.
Demographic Variables Used in this Report
The data on sexual behavior, attraction, and identity presented in this report are shown with respect to several key background or demographic characteristics including age, marital or cohabiting status, educational attainment, and Hispanic origin and race. Age of respondent and educational attainment reflect status at time of interview. Educational attainment is shown based only on respondents 22-44 because large percentages of those aged 15-21 are still attending school. Using the full 15-44 age range would potentially underestimate the percentage of persons with a college degree. The definition of marital or cohabiting status used in this report also reflects status at time of interview and includes only those relationships with opposite-sex spouses or partners, in keeping with the recoded variables that have been defined across all NSFG surveys to date. While it is theoretically possible to construct a measure of same-sex cohabitation using the NSFG household roster information, the sample sizes reporting these relationships do not permit analyses for this population subgroup.
The definitions of Hispanic origin and race used in this report take into account the reporting of more than one race, in accordance with 1997 guidelines from the Office of Management and Budget. However the 2006-2008 NSFG's sample does not include sufficient numbers of respondents of multiple race or single-race groups other than black and white to be able to show more detail in the tables. For convenience in writing, the short term "black" or "non-Hispanic black" will be used instead of the full phrase, "non-Hispanic black or African American, single race." Similarly, the term "white" or "non-Hispanic white" will be used instead of the full phrase, "Non-Hispanic white, single race." The full forms of these category labels are shown in the tables. Further technical details and definitions of terms associated with the demographic variables used in this report can be found in earlier NSFG reports (23-24, 3132).
In this report, the term "intercourse" refers to heterosexual vaginal intercourse. The terms "sex" or "sexual contact" refer to all types of sexual activity, including vaginal intercourse, oral sex, and anal sex, either with opposite-sex or same-sex partners. All other measures related to sexual behavior, attraction, and identity are described in more detail further below.
Measurement of Sexual Behavior in NSFG ACASI
This section defines the sexual behaviors and related variables presented in this report, in part by showing the wording of the questions asking about them. The NSFG is historically and primarily a study used to measure factors related to pregnancy and birth rates (24, 32-33). For this purpose, much of the main part of the interview, administered by the interviewer, is focused on behaviors most closely related to birth and pregnancy rates -- namely, heterosexual vaginal intercourse, contraceptive use, infertility, breastfeeding, and heterosexual marriage and cohabitation. The self-administered, or ACASI part of the interview, includes questions on a wider range of sexual activities, including oral and anal sex with opposite-sex partners and sexual contact with same-sex partners, in order to address more factors related to risk of HIV and
other STIs.
The wording of the NSFG questions on sexual behaviors was based on wording used in previous studies, along with consultations with the directors of many of those studies and other experts. As described earlier, answering questions in ACASI means that respondents saw the question text on the computer screen, or heard the question through headphones, or both. They entered their responses directly into the laptop computer and were routed by the interview program to the next applicable question. Between Cycle 6 (2002) and the 2006-2008 NSFG, there were a few small changes made to the ACASI portion of the interview for males and females, such as improvements in routing, changes in question wording and changes to response categories to improve clarity. The NSFG User's Guide Appendix 5, "Summary of NSFG Questionnaire Changes" provides a detailed list of these changes (33). The User's Guide supplement for the 2006-2008 ACASI data files also provides detail on the changes made from
Cycle 6 (2002) (34).
Below is the question wording related to types of sexual behavior in the NSFG ACASI section for 2006-2008. All of these questions were not asked in the actual sequence shown below. To see the questions in their full context, with intervening questions, please see the full questionnaires on the NSFG webpage (http://ww.cdc.gov/nchs/nsfg.htm).
Types of Sexual Behavior for Female Respondents: The question on vaginal intercourse with a male partner was only asked in ACASI for those female respondents who did not provide clear evidence of intercourse in the interviewer-administered portion of the interview. Specifically, if the respondent had ever been married or cohabited with a male partner or if she had ever been pregnant, she was not asked again in ACASI about vaginal intercourse. The question wording for all other respondents was as follows:
"Has a male ever put his penis in your vagina (also known as vaginal intercourse)?" All female respondents answered two questions on oral sex with male partners and one question on anal sex with male partners. The two questions on oral sex with a male partner are shown below, following a preface:
"The next few questions are about oral sex. By oral sex, we mean stimulating the genitals with the mouth."
• "Has a male ever performed oral sex on you?"
• "Have you ever performed oral sex on a male? That is, have you ever stimulated his penis with your mouth?"
Below is the question female respondents were asked about anal sex with a male:
• "Has a male ever put his penis in your rectum or butt (also known as anal sex) ?"
With regard to same-sex sexual partners, female respondents were asked up to 3 questions on sexual contact with female partners, following a preface:
"The next questions ask about sexual experiences you may had with another female."
• Have you ever performed oral sex on another female?"
• "Has another female ever performed oral sex on you?"
If the respondent answered no to both of the above questions on oral sex with a female partner, then she was asked the more general question that mirrors the single question that females were asked on same-sex experience in the 2002 NSFG.
• "Have you ever had any sexual experience of any kind with another female?"
A "yes" answer to any of these 3 questions was classified as "same-sex sexual behavior" for females. The more specific behavioral questions on oral sex with a female partner were added for the 2006-2008 NSFG due to concerns that the single question asked in 2002 was too vague to be interpretable and could not be compared with the male data on same-sex sexual experience.
Types of Sexual Behavior for Male Respondents: As for female respondents, the question on vaginal intercourse with a female partner was only asked in ACASI for those male respondents who did not provide clear evidence of intercourse in the interviewer-administered portion of the interview. Specifically, if the respondent had ever been married or cohabited with a female partner or if he had ever fathered a pregnancy, he was not asked again in ACASI about vaginal intercourse. The question wording for all other respondents was as follows:
"Have you ever put your penis in a female's vagina (also known as vaginal intercourse)?"
All male respondents answered two questions on oral sex with female partners and one question on anal sex with female partners. The two questions on oral sex with a female partner are shown below, following a preface:
"The next few questions are about oral sex. By oral sex, we mean stimulating the genitals with the mouth."
• "Has a female ever performed oral sex on you, that is, stimulated your penis with her mouth?"
• "Have you ever performed oral sex on a female? "
Below is the question male respondents were asked about anal sex with a female:
• "Have you ever put your penis in a female's rectum or butt (also known as anal sex)?"
With regard to same-sex sexual partners, male respondents were asked four questions on same-sex sexual contact with male partners, following a preface:
"The next questions ask about sexual experiences you may have had with another male. Have you ever done any of the following with another male?"
• "Have you ever performed oral sex on another male, that is, stimulated his penis with your mouth?"
• "Has another male ever performed oral sex on you, that is, stimulated your penis with his mouth?"
• "Has another male ever put his penis in your rectum or butt (anal sex) ?"
• "Have you ever put your penis in his rectum or butt (anal sex) ?"
A "yes" answer to any of these 4 questions was classified as "same-sex sexual behavior." A "yes" to either of the oral sex questions was classified as "any oral sex with a male," and a "yes" answer to either of the anal sex questions was classified as "any anal sex with a male." Unlike the question series for female respondents in the NSFG's ACASI, male respondents who answered "no" to all four of the specific behavioral questions were not asked a more general question about "any sexual experience of any kind with a male partner."
Numbers of Opposite-Sex Sexual Partners: In the 2006-2008 NSFG ACASI, all respondents who reported ever having vaginal, oral, or anal sex with an opposite-sex partner were asked their total numbers of opposite-sex partners in their lifetime (to time of interview) and in the last 12 months. These questions are shown below as worded for females, and analogous questions were asked for males. The phrasing of the prefatory sentence is due to the placement of this question right after a series of questions about nonvoluntary vaginal intercourse.
Number of male (opposite-sex) partners in lifetime:
"This next question is also about your male sex _partners. This time, think about any male with whom you have had vaginal intercourse, oral sex, or anal sex - any of these.
Thinking about your entire life, how many male sex partners have you had? Please count every partner, even those you had sex with only once."
Number of male (opposite-sex) partners in last 12 months:
"Thinking about the last 12 months, how many male sex partners have you had in the 12 months since [appropriate month/year filled in]? Please count every partner, even those you had sex with only once in those 12 months."
Numbers of Same-Sex Sexual Partners: All respondents who reported ever having any same-sex sexual experience were asked their total number of same-sex partners in their lifetime and in the last 12 months. Again, these questions are shown below as worded for females, and analogous questions were asked for males.
Number of female (same-sex) partners in lifetime:
"Thinking about your entire life, how many female sex partners have you had? Number of female (same-sex) partners in last 12 months:
"Thinking about the last 12 months, how many female sex partners have you had in the 12 months since [appropriate month/year filled in]? Please count every partner, even those you had sex with only once in those 12 months."
For one table in the report (table 9), the total number of partners in the last 12 months was defined based on opposite-sex and same-sex partners. Because the numbers of respondents reporting more than 1 same-sex partner in the last year was too small to show separately, the table groups all those who reported any same-sex partners in the last year. Those who had no same-sex partners in the last year are broken down by their number of opposite-sex partners in the last year (1 versus 2 or more).
Measurement of Sexual Attraction and Identity
In ACASI, all respondents were also asked questions on sexual attraction and sexual identity. Based on prior analyses with the 2002 NSFG (9) and NCHS cognitive lab testing results based on the National Health and Nutrition Examination Survey (NHANES) (35), the sexual identity response categories were modified for 2006-2008 to include additional words that respondents may recognize more readily. The "heterosexual" category was reworded to say "heterosexual or straight." The homosexual category was changed to say "homosexual or gay' for men and "homosexual, gay, or lesbian" for women.
For females, the questions were:
"People are different in their sexual attraction to other people. Which best describes your feelings ? Are you...
Only attracted to males
Mostly attracted to males
Equally attracted to males and females
Mostly attracted to females
Only attracted to females
Not sure "
"Do you think of yourself as ...
Heterosexual or straight Homosexual, gay, or lesbian, Bisexual
Or something else?" For males, these questions were:
"People are different in their sexual attraction to other people. Which best describes your feelings? Are you ..
Only attracted to females
Mostly attracted to females
Equally attracted to females and males
Mostly attracted to males
Only attracted to males
Not sure"
"Do you think of yourself as ...
Heterosexual or straight Homosexual or gay Bisexual
Or something else?"
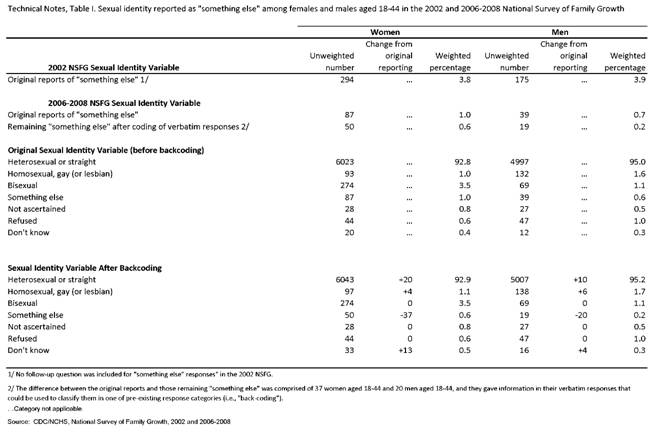
Given the higher than expected percentages reporting "something else" in the 2002 NSFG (3.8-3.9%), ACASI respondents who answered "something else" in the 2006-2008 NSFG were asked a follow-up question to clarify what they meant:
"When you say something else, what do you mean? Please type in your answer."
Based on their verbatim, typed responses, a number of respondents who had answered "something else" could be unambiguously classified (or "back-coded") into the provided response categories. Due to significantly lower levels of "something else" seen in the original, pre-back-coded data from 2006-2008, as well as the expense of administering and coding this follow-up question, the "something else" response option, along with the verbatim follow-up, was dropped beginning in July 2008. NSFG respondents interviewed after this point either chose one of the three response categories provided or chose "don't know" or "refused," as is allowed on any question in the survey. In this report, all respondents who chose "don't know" or "refused" are grouped as "did not report.") For further information on the NSFG's measurement of sexual identity, see Technical Notes.
Strengths and Limitations of the Data
The data presented in this report are primarily from the 2006-2008 NSFG, which has a number of strengths for studying sexual behavior in the U.S. population:
• The NSFG has a rigorous probability sampling design, so the estimates can be generalized to the national population.
• The response rate for the NSFG was 75 percent, which is considered high in household survey research, and suggests that the data for most statistics can be generalized to the population with confidence.
• Questions asked on the NSFG have undergone testing and review in an effort to make them understandable to persons participating in the survey. For example, a pretest was conducted before the Cycle 6 (2002) NSFG that included a number of randomized experiments to test ideas from the survey methodology literature to improve data collection (36). In addition, most of the ACASI questions used in this report were also asked in the 2002 NSFG, and some were refined as a result of that experience (34).
• Sensitive questions associated with sexual behavior, reproductive health or drug abuse were collected using ACASI methods, which have been found to yield more complete reporting of sensitive behaviors, and they also avoid the large amounts of missing data often found due to routing mistakes through self-administered paper-and-pencil questionnaires (9, 30).
• The questionnaire was administered in both English and Spanish; those who preferred to answer the interview in Spanish were interviewed by bilingual interviewers. The
translation of the questionnaire into Spanish was done with particular attention to making it understandable and culturally appropriate for major Hispanic groups including Mexicans, Puerto Ricans, and to recent immigrants and those with limited education (37).
The data included in this report also have some limitations:
• As a household-based sample survey, the NSFG excludes from the sampling frame those who are currently homeless, incarcerated or otherwise institutionalized, and those living on military bases in the U.S. (The NSFG sample does include respondents with past experience with military service or incarceration who currently live in the household population, including respondents on active-duty with the military, but not living on military bases.) To the extent that groups excluded from the NSFG sample may have different patterns of sexual behavior, the survey results cannot be generalized to those populations.
• As in any survey, nonsampling error could affect the results. The NSFG makes use of extensive quality control procedures to try to minimize the effects of such errors (21-22).
• The results could be affected by underreporting of sensitive behaviors, although using ACASI has been found to yield more complete reporting of these items than other types of questionnaires (30).
• The NSFG provides national estimates, but is not designed to provide state or local estimates of the behaviors described in this report.
• The age range of the NSFG is 15-44 years of age. Therefore it is not possible to measure the sexual behavior of those under age 15 or over 44 years of age.
• Given the sample size of the 2006-2008 NSFG, the numbers of men and women in the sample who have had sexual contact with same-sex partners, while larger than in most other studies, are still relatively small, so the sampling errors of percentages for these groups are larger than they are for larger groups. It also means that the amount of subgroup analysis (for example, by age, race or ethnicity, and other characteristics) that can done for these populations is limited.
• The scope of this report is limited to a few measures of sexual behavior, attraction, and identity that could be studied within the sample sizes of the 2006-2008 NSFG. With the release of the larger 2006-2010 NSFG data, more detailed and statistically powerful subgroup analyses will be possible.
Statistical Analysis
All estimates in this report are based on sampling weights that are designed to produce unbiased estimates for the approximately 124 million men and women aged 15-44 in the United States. The statistical package SAS, Version 9.2, was used to produce all estimates of percentages and numbers in this report (www.sas.com). SUDAAN software was used to estimate the sampling errors of the statistics; this software takes into account the use of weighted data and the complex design of the sample in calculating estimates of standard errors and significance tests (http://www.rti.org/sudaan/). Each table in this report includes standard errors as a measure of the precision of each point estimate, including all percentages and medians.
Significance of differences among subgroups was determined by standard two-tailed t-tests using point estimates and their standard errors. For selected comparisons, chi-square tests
of overall association were also performed within SUDAAN's Proc Crosstab. No adjustments were made for multiple comparisons. Terms such as "greater than" and "less than" indicate that a statistically significant difference was found. Terms such as "similar" or "no difference" indicate that the statistics being compared were not significantly different. Lack of comment regarding the difference does not mean that significance was tested and ruled out.
In the description of the results below, when the percentage being cited is below 10 percent, the text will cite the exact percentage to one decimal point. To make reading easier, and to remind the reader that the results are based on samples and subject to sampling error, percentages above 10 percent will generally be shown rounded to the nearest whole percent. Readers should pay close attention to the sampling errors for small groups, such as sub-groups of teenagers or persons who report same-sex sexual behavior. In this report, percentages are not shown if the denominator is less than 100 cases, or the numerator is less than 5 cases. When a percentage or other statistic is not shown for this reason, the table contains an asterisk signifying that the "statistic does not meet standards of reliability or precision." For most statistics presented in this report, the numerators and denominators are much larger.
Results
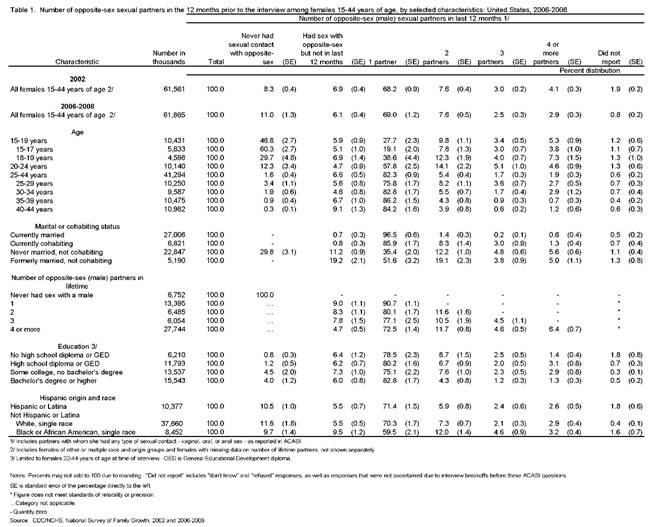
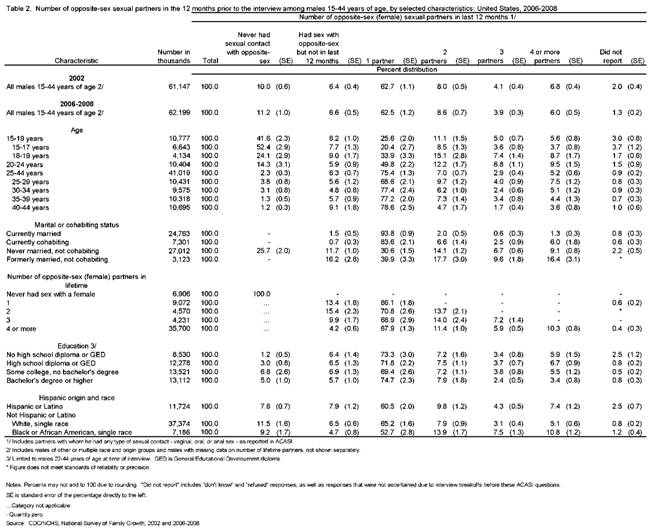
Numbers of opposite-sex sexual partners in the last 12 months and in lifetime among persons 15-44 years (tables 1-4):
Tables 1-4 give numbers of opposite-sex sexual partners involving vaginal, oral, or anal sex, as reported by selected groups of men and women aged 15-44. The first 2 tables describe numbers of partners in the past 12 months, and the latter 2 tables summarize numbers of partners in lifetime (defined as "to this point in their lives" or "by time of interview"). Each table also compares the percent distribution in 2006-2008 with what was seen in Cycle 6 (2002). While it is recognized that social network and structural factors are also important in explaining disparities across population subgroups, studies have documented the correlation of higher numbers of sexual partners with increased risk and prevalence of STIs (1, 2, 9, 12, 28, 38).
Among women 15-44 in the 2006-2008 NSFG, 11% had never had any form of sexual activity with a male partner in their lives, 6.1% had sex in their lifetime but had no opposite-sex sexual activity in the past 12 months, and 69% had 1 male partner in the past 12 months. Nearly 8% had 2 partners in the past year, and about 5% had 3 or more partners in the past year. These percentages were all similar to the distribution of numbers of partners seen in 2002. Given that sexual experience is associated with age, table 1 also shows the distribution by numbers of partners for women aged 25-44). Among women 25-44, 1.6% never had any form of sexual activity with a male partner, 6.6% have had sex with a male but not in the past year, and 82% had 1 partner in the past year. Having 1 partner in the past 12 months was more common at older ages, presumably because more of these women are married. Having 1 partner in the past year was significantly more common among married (97%) or cohabiting (86%) women than those in other groups. No significant difference was seen by educational attainment in the percentages reporting 1 partner in the past year. However, women 22-44 with less than a high school diploma were nearly twice as likely (13%) to have had 2 or more partners in the past 12 months as women with a Bachelor's degree or higher (7%). No difference was seen by race and Hispanic origin in the percentages reporting 4 or more partners in the past year; however non-
Hispanic black women were significantly less likely to report 1 partner in the past year (60%) relative to Hispanic women (71%) and non-Hispanic white women (70%). This difference in distribution appears related to higher percentages of black women reporting 2 partners in the past year (12%) compared with Hispanic (5.9%) and white women (7.3%).
Among men 15-44 shown in table 2, the percentage distribution by numbers of partners in the past year was similar to the distribution for women in 2006-2008, and also for men in the 2002 survey. About 11% had no sexual contact of any kind with a female partner, 6.6% had no opposite-sex contact in the past year, 63% had 1 partner, 8.6% had 2 partners, and roughly 10% had 3 or more partners. Among men 25-44, similar percentages as seen for women 25-44 had never had sexual contact with a female (2.3%) or had sex in their lifetime but not in the past year (6.3%). A lower percentage of men 25-44 (75%) than women 25-44 (82%) reported having 1 partner in the past year, likely due to the higher percentages of men reporting higher numbers of partners overall for the past year. In general, the associations with age, marital/cohabiting status, education, and race and Hispanic origin were also similar to what was seen for women in 20062008. Of note, somewhat lower percentages of men in all race/origin groups had 1 partner in the past year - 65% of non-Hispanic white men, 61% of Hispanic men, and 53% of non-Hispanic black men, compared with 70%, 71%, and 60% of their female counterparts.
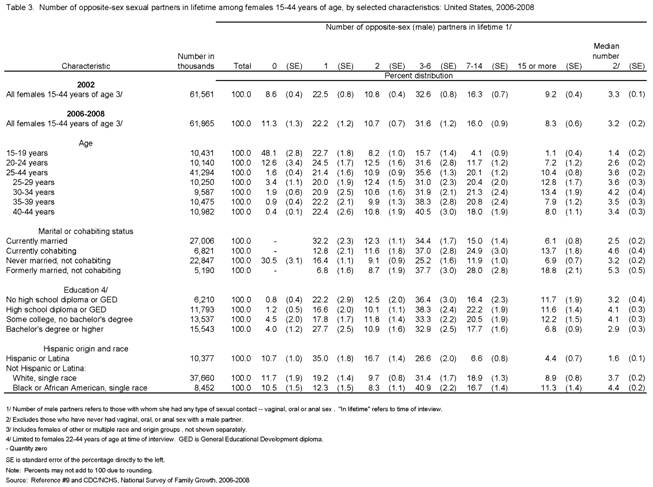
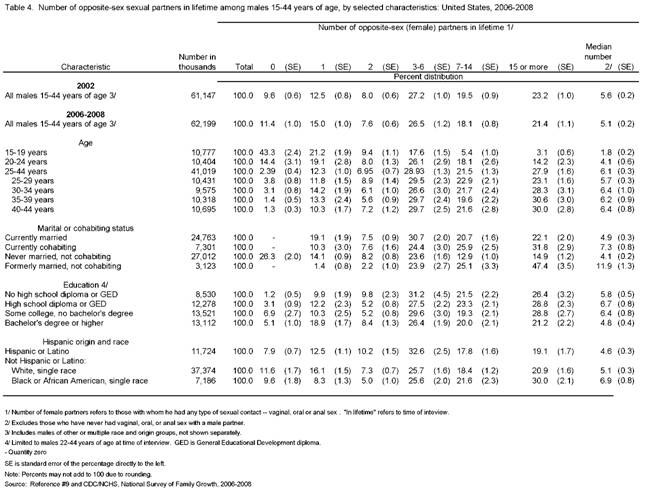
Tables 3 and 4 show the total numbers of opposite-sex sexual partners of any type reported by men and women to this point in their lives (called "lifetime" number here). These data from 2006-2008 show little change since the 2002 NSFG. Among women 15-44, the median number of male partners is 3.2, and in 2002 it was essentially the same at 3.3. For men 15-44, the median number of female partners was 5.6 in 2002 and remained similar at 5.1 in 2006-2008. As in 2002 when 23% of men and 9% of women reported 15 or more partners in their lifetimes, men were more likely than women to report 15 or more partners in 2006-2008 (21% of men and 8% of women). This is likely to explain, in part, the higher median number of partners for males. These results are consistent with prior findings from surveys in the U.S. and other countries, which all show that men on average report higher numbers of opposite-sex sexual partners than do women of the same age range (9, 12, 14, 31-32). Several explanations for this ubiquitous finding have been suggested and all play some role in the NSFG results presented here:
• The possibility that survey respondents are reporting sexual partners outside the sample frame of the NSFG, such as:
o Partners outside the age range of 15-44, which would be quite plausible given
typical age gaps between sexual partners or spouses o Partners outside the general U.S. household population (e.g., prison, military,
homeless, commercial sex workers, partners in other countries)
• The occurrence of extreme values in the reporting of numbers of sexual partners - for example, a small proportion of men or women may be reporting extremely high numbers, and these values will skew the means and possibly the median values if the proportions of men reporting higher numbers of partners are sufficiently large compared with women -
as seen in the 2002 and 2006-2008 NSFG.
• There may be variations in what different groups of respondents may include in their counts of sexual partners, perhaps defined by the type of sexual activity involved, the duration or type of relationship, and concurrency with other partners (38-43).
• Over-reporting by men and under-reporting by women may accentuate the gender disparity despite all efforts to improve the accuracy of this self-reported, sensitive information.
Despite variation in the self-reported numbers of sexual partners reported among men and women, number of partners in lifetime has been shown to be consistently reported in the NSFG and other nationally-representative household surveys (44), and, in the general household population, remains correlated with HIV (44) and other STIs (1, 2, 9, 12, 38, 46-50).
As expected, current age is the strongest correlate shown in tables 3 and 4 for numbers of partners in lifetime. With regard to marital/cohabiting status, formerly married, noncohabiting men and women, followed by current cohabitors, were more likely to report 15 or more opposite-sex partners and to have higher median numbers than those in the other groups. For women more so than for men, higher educational attainment was associated with lower percentages with 15 or more partners in lifetime. While 11-12% of women with lower levels of education reported 15 or more partners, 6.8% with bachelor's degrees or higher reported 15 or more partners. For men (table 4), the disparity by college education was smaller but still apparent.
Though men were more likely than women to report higher numbers of opposite-sex sexual partners in their lifetimes, men and women showed a similar pattern of association between numbers of opposite-sex partners and race and Hispanic origin. Among women, Hispanic women were less likely to have had 15 or more partners (4.4%) than were non-Hispanic white (8.9%) and black women (11.3%). Among men, the comparable figures with 15 or more partners were 19% for Hispanic, 21% for white, and 30% for black men. These differences by race/origin may relate to differences in marital/cohabiting status, age at marriage, education, and age distributions. Future NSFG data sets with larger numbers of interviews will allow more detailed subgroup analyses.
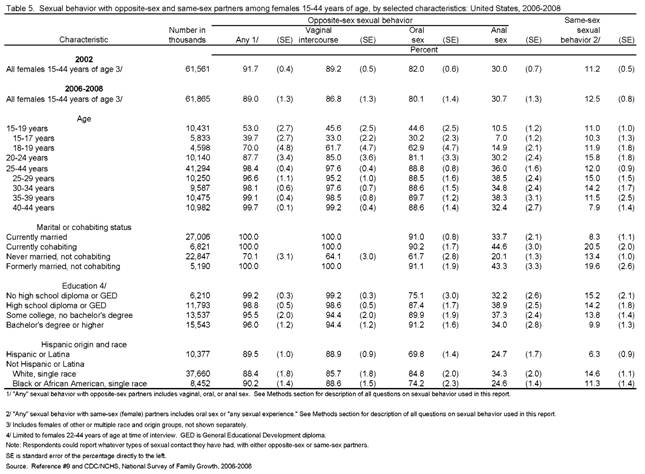
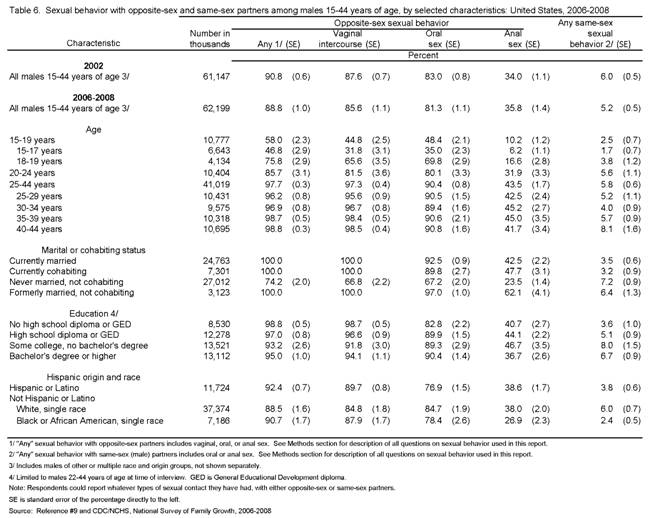
Types of sexual behavior with opposite-sex and same-sex partners among persons 15-44 years (tables 5-6):
Tables 5 and 6 show percentages of men and women who ever had the specified types of sexual contact with opposite-sex and same-sex partners. Several studies have documented that oral and anal sex can transmit HIV and certain STIs, such as gonorrhea, Chlamydia, genital herpes, chancroid, and syphilis (51-54). Indeed, an increasing proportion of cases of genital herpes in the United States are being attributed to oral sex (50). Although risk of HIV transmission is lower for oral sex than for vaginal intercourse or anal sex, HIV transmission through oral sex is known to occur (54). Some groups may also be at elevated risk of HIV transmission through oral sex, including men who have sex with men and certain drug users (52). For opposite-sex partners, the percentages that ever had vaginal, oral, and anal sex are presented separately. (More detail for younger people is shown in tables 7-8, and more detail for same-sex partners is shown in table 10.) Comparable percentages of men and women have had any opposite-sex sexual contact, vaginal intercourse, and oral sex with opposite-sex partners. Somewhat higher percentages of men (36%) than women (31%) report ever having had anal sex. Given that percentages reporting specific types of sexual experience may increase with age and level off in adulthood, figure 1 shows the percentages of men and women 25-44 who reported different types of sexual behavior. As in the 2002 NSFG, nearly all men and women 25-44 (97% of men and 98% of women) have had vaginal intercourse; 90% of men and 89% of women have had oral sex with opposite-sex partners. Anal sex with opposite-sex partners was reported by
36% of women and 44% of men 25-44. Some form of same-sex sexual behavior was reported by twice as many women 25-44 (12%) as men 25-44 (5.8%).
With regard to opposite-sex partners, no clear-cut patterns by educational attainment were seen in the reporting of anal sex among men or women 22-44. Among both men and women 22-44, oral sex was reported more often by those with bachelor's degrees or higher (91% of women and 90% of men) than those with no high school diploma or GED (75% of women and 83% of men). Oral sex with an opposite-sex partner was reported more often by non-Hispanic white men and women (85%) than by those in other Hispanic origin and race groups shown. More Hispanic men (77%) reported opposite-sex oral sex experience than did Hispanic women
(70%).
Looking at same-sex sexual experience, men showed no significant differences by educational attainment, but women with Bachelor's degrees or higher were less likely to report same-sex sexual behavior than women in the other education categories. Hispanic women (6.3%) were less likely than either non-Hispanic white (15%) or black women (11%) to report same-sex sexual behavior. Among men, non-Hispanic white men were more likely than either Hispanic men or non-Hispanic black men to report such behavior.
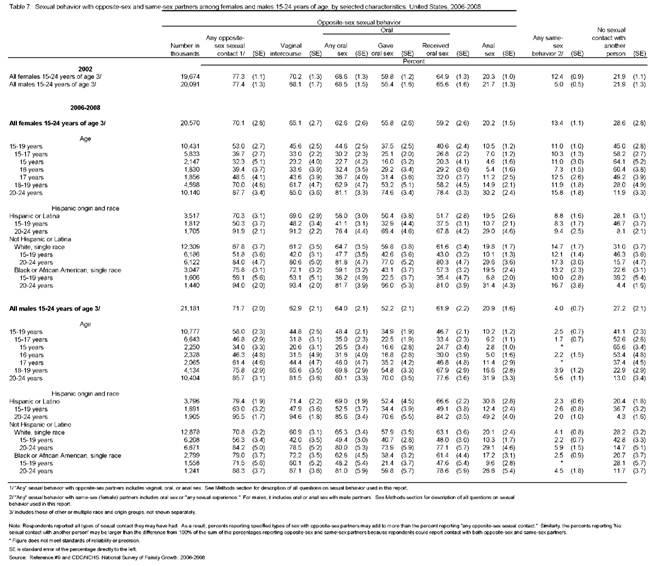
Types of sexual behavior with opposite-sex and same-sex partners among persons 15-24 years (tables 7-8):
Table 7 presents similar information on sexual behavior as shown in tables 5 and 6, but focused on teens and young adults, and includes an additional column for those who have never had any sexual contact with another person, male or female. This focused look at oral and anal sex among teens and young adults is prompted by concerns that some young people may engage in other types of sexual contact before they have vaginal intercourse, to avoid the risk of pregnancy; in addition to placing themselves at risk of STIs, some studies have documented that that engaging in these other types of sexual contact may hasten young people's initiation of vaginal intercourse (9, 55-60). Table 7 shows that 27% of 15 year old boys and 23% of 15 year old girls have ever had oral sex with an opposite-sex partner. At ages 18-19, those percentages are 70% for boys and 63% for girls. Among 15-17 year olds, 6.2% of boys and 7.0% of girls have had anal sex with an opposite-sex partner. Any same-sex sexual behavior was reported by nearly 2% of boys and 10% of girls aged 15-17. Compared with data from the 2002 NSFG, a higher percentage of males and females 15-24 in 2006-2008 have had no sexual contact with another person. In 2002, 22% of young men and women 15-24 had never had any sexual contact with another person, and in 2006-2008, those figures were 27% for males and 29% for females.
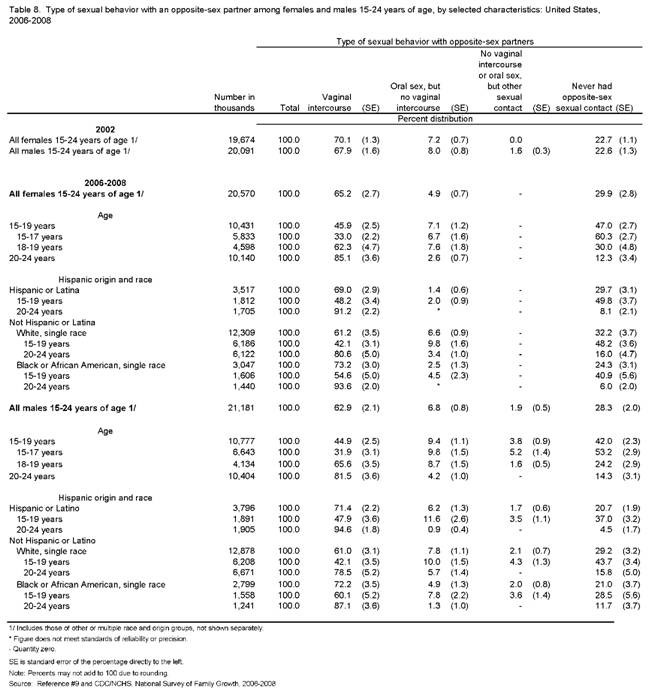
Given the public health concern about young people potentially placing themselves at risk for STIs even though they may abstain from vaginal intercourse (55-61), table 8 classifies young people 15-24 by the type of sexual behavior they have engaged in with an opposite-sex partner. Those who have had vaginal intercourse at all are shown in the first column of percentages, followed by those who have never had vaginal intercourse but have had oral sex. The 2006-2008 NSFG data indicate that 6.8% of males 15-24 and 4.9% of females 15-24 have had oral sex but no vaginal intercourse. As depicted in figure 2, the percentages of young people who have only had oral sex but not vaginal intercourse are very low and decline with age as they begin to have vaginal intercourse, but these percentages reflect just part of the subgroup of young people who may potentially be placing themselves at risk of STIs or HIV before they
are ever at risk of pregnancy. Some proportion of young people in the upper lines of figure 2, those who have had vaginal intercourse, may also have had oral sex before their first intercourse.
To address this gap in the data, in 2007 (year 2 of the 2006-2008 NSFG), a new question was added to the female and male questionnaires to determine the relative timing of oral sex and vaginal intercourse for all those aged 15-24 who reported both types of sexual contact. For females, this "TIMING" question read, "Thinking back to when you had oral sex with a male for the first time, was it before, after, or on the same occasion as your first vaginal intercourse with a male?" An analogous question was asked of males about sex with females. The respondent could choose one of the following responses:
• "Before first vaginal intercourse"
• "After first vaginal intercourse"
• "Same occasion"
Table A gives the percentages of males and females aged 15-24 who had oral sex before they ever had vaginal intercourse. These percentages include those who either responded "before first vaginal intercourse" on the TIMING question in ACASI or who had not yet had vaginal intercourse but have had oral sex. About half of males and females 15-24 in 2006-2008 have had oral sex before their first vaginal intercourse. Among those who have had vaginal intercourse, older age at first intercourse was associated with higher percentages having had oral sex first: 41% of young people 15-24 who had first vaginal intercourse at age 17 or younger had oral sex before first vaginal intercourse, compared with 70% of those who had first intercourse at age 20 or older. Non-Hispanic black and Hispanic males and females aged 15-24 were about 2/3 as likely as non-Hispanic white youth to have had oral sex before first vaginal intercourse or to have only had oral sex (39% compared with 57%).
Distribution of number of sexual partners in the past year (including opposite-sex and same-sex partners)
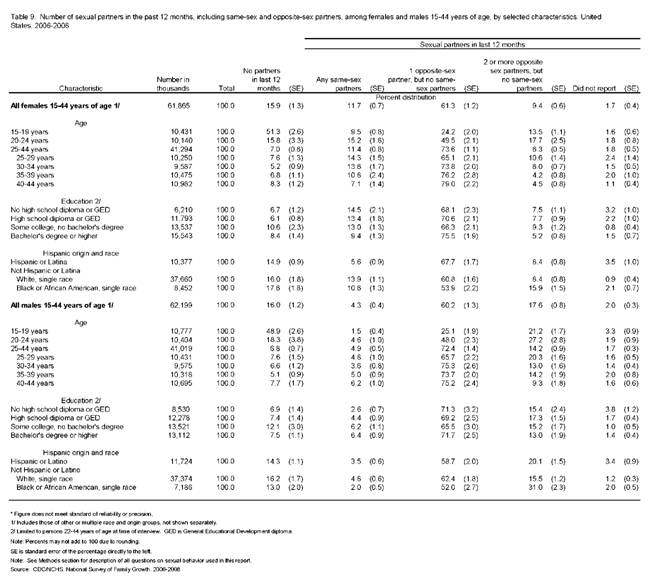
Table 9 gives the percent distribution of all males and females 15-44 by the sex and number of their partners in the last 12 months, including sexual behavior with opposite-sex and same-sex partners. Unlike tables 1 and 2 that looked solely at numbers of opposite-sex partners in the past year, table 9 combines opposite-sex and same-sex partners to describe overall sexual experience in the past year for persons aged 15-44. Due to small sample sizes in the 2006-2008 data, it was not possible to subdivide those with any same-sex experience by their numbers of partners, nor was it possible to show the percentages that had both male and female partners in the past year. Roughly three in five men or women had one opposite-sex partner in the last 12 months, and 16% reported no partners at all. The distributions for men and women differed for two categories: twice as many men as women (18% compared to 9.4%) reported 2 or more opposite-sex partners in the last 12 months, and nearly 3 times as many women as men reported any same-sex partners in the past 12 months (12% compared with 4.3%).
For women 22-44, no clear patterns was seen by educational attainment in the sex and number of sexual partners in the past year, but those with a bachelor's degree or higher were less likely to report any recent same-sex partners than those in the other education groups (9.4% compared with 13-15%). Among men 22-44, a somewhat opposite association with education was seen, with higher reports of recent same-sex partners for men in higher education groups.
For both men and women, the data indicate higher reports of "no partners in the last 12 months" for persons with some college but no Bachelor's degree, relative to the other education groups.
With regard to Hispanic origin and race, higher percentages of non-Hispanic black men and women reported "2 or more opposite-sex partners" in the past year, compared to the other Hispanic origin and race groups shown. Non-Hispanic black men (31%) were twice as likely as black women (16%) to report 2 or more opposite-sex partners in the past year.
Black men (2%) were less likely to report recent same-sex partners than white men (4.8%), but no difference was seen between black and Hispanic men (3.5%). Hispanic women were less likely than either non-Hispanic white or black women to report recent same-sex partners.
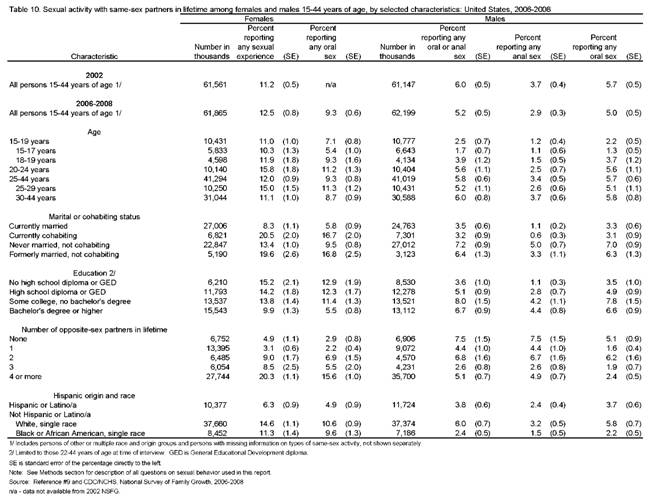
Same-sex sexual activity among persons 15-44 years (table 10):
Further detail on same-sex sexual activity "in lifetime" (or to this point in their lives) is shown in table 10 for males and females 15-44. As noted in tables 5 and 6, twice as many women as men report having had any same-sex sexual contact in their lifetimes (13% of women and 5.2% of men). When the 2002 NSFG data on this topic were published (9), there had been speculation that the questions on same-sex sexual activity were not sufficiently comparable or specific for females, and that this may draw into question any male-female difference seen. As a result, more behaviorally specific questions were added to the 2006-2008 NSFG ACASI (see Methods section) to ask female respondents about oral sex with a female partner, and only those who did not report oral sex with a female partner were asked the more general question about any sexual contact with a female. The 2006-2008 data show that 12.5% of women 15-44 reported any same-sex sexual experience with a female partner, and 9.3% reported they ever had oral sex with a female partner. This indicates that most of the reporting (about 75%) of same-sex experience among females is accounted for by oral sex, rather than the more general question about "any sexual experience." This figure of 9.3% of women reporting oral sex with a female partner is still higher than the 5.2% of men reporting any oral or anal sex with a male partner, and it may be the more comparable figure because it is based on specific behaviors. Looking at the different characteristics shown in table 10, similar patterns of association were seen with both "any same-sex experience" and "any oral sex" with a female partner. As noted in the Methods section, men who answered "no" to the specific same-sex behavioral questions were not asked, as were women, the more general question about "any sexual experience with a male partner." It is therefore unknown whether asking such a question would have increased reports of same-sex experience among men to the levels seen among women or possibly narrowed the gender gap.
Marital or cohabiting status showed a somewhat different association with same-sex experience for men and women. Married (3.5%) or cohabiting men (3.2%) reported lower levels of same-sex experience than never married (7.2%) or formerly married men (6.4%), while for women lower percentages of same-sex experience were seen for currently married (8.3%) or never married women (13%) compared with formerly married women (20%) or cohabiting women (21%). Similar patterns by marital or cohabiting status were seen among women reporting oral sex with female partners as among women reporting any same-sex experience. (As was noted in the Methods section, the NSFG classifies as "cohabiting" only those who are cohabiting with an opposite-sex partner so this difference does not reflect misreporting or misclassification of same-sex cohabitations.) Education also showed a different association with
same-sex experience by gender. Women 22-44 with a bachelor's degree or higher were less likely to report same-sex experience than those in the other education groups (9.9% vs. 14-15%). Similar patterns were seen among women specifically reporting oral sex with female partners. For men, the pattern was less clear-cut, but higher educational attainment was associated with higher reports of same-sex experience.
Table 10 also shows same-sex experience according to numbers of opposite-sex partners in lifetime. For men the prevalence of same-sex experience does not correlate closely with numbers of opposite-sex partners, but for women, those who reported 4 or more opposite-sex partners in their lifetimes were more likely to report any same-sex experience (20%) or same-sex oral sex (16%) than those with fewer or none. With regard to Hispanic origin and race, the associations with same-sex experience are again somewhat different between men and women. Non-Hispanic white men (6%) were more likely to report any oral or anal sex with a male partner than were non-Hispanic black men (2.4%), and this appears to be driven by differences in both oral and anal sex. No difference in reporting was seen between Hispanic men and non-Hispanic white men. Among women, Hispanic women were less likely than either non-Hispanic white or black women to report same-sex experience, including same-sex oral sex.
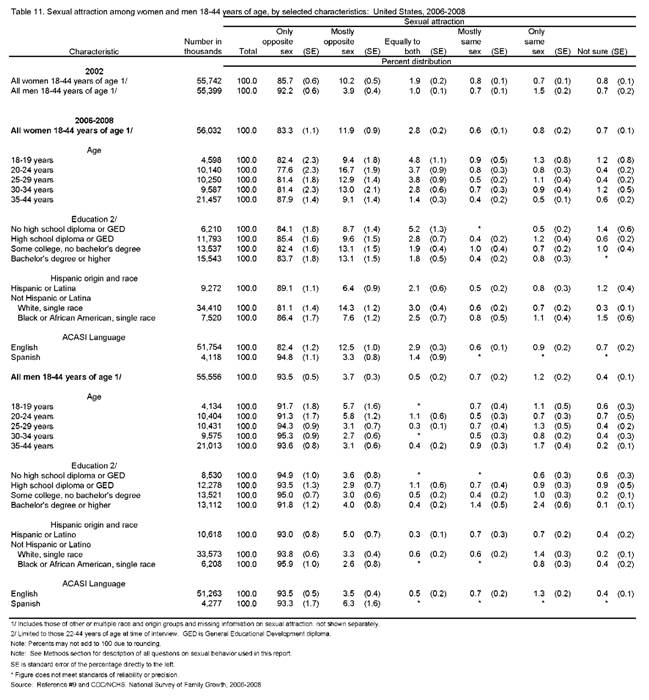
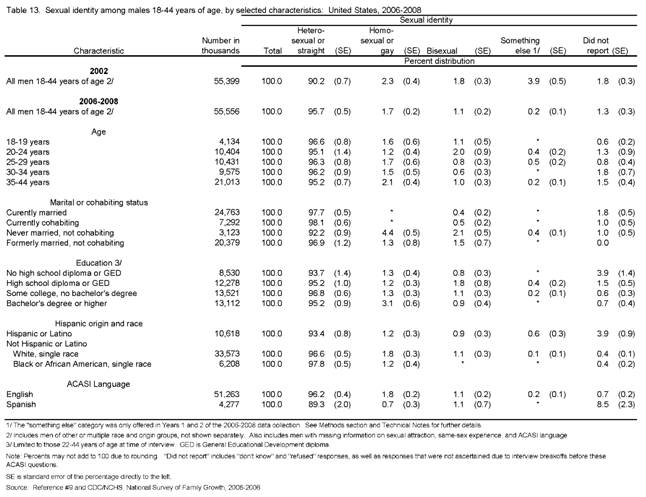
Sexual attraction and sexual identity among persons 18-44 years (tables 11-13):
The measures of sexual attraction and identity are shown in this report only for adults aged 18-44 in order to facilitate comparisons with other surveys, and also because these characteristics may not yet be known or accurately reported among teens 15-17 (62). Sexual attraction and identity as stated at the time of interview are presented here as important risk markers for HIV and STIs. They are not intended to substitute for actual behavioral risk factors such as same-sex sexual behaviors presented earlier in this report, but are correlated with reports of same-sex behavior to show the extent to which their use as risk markers may be warranted.
Table 11 shows the full distribution of men and women 18-44 by their sexual attraction. Women in 2006-2008 were less likely than men to report they are attracted "only to the opposite sex" - 83% of women, compared with 94% of men, and this pattern is similar to patterns seen in 2002. However, when the "only to opposite sex" and "mostly to opposite sex" categories are summed, no difference is seen between men and women. To address concerns that socioeconomic factors or language barriers may play a role in the reporting (or mis-reporting) of sexual attraction and identity, tables 11-13 show these variables tabulated by education, Hispanic origin and race, and the language in which ACASI was conducted. Among men, no clear-cut patterns in sexual attraction were seen by education, Hispanic origin and race, or ACASI language, but among women some differences were seen in table 11. Non-Hispanic white women (81%) were less likely than Hispanic women (89%) and black women (86%) to say they are attracted "only to the opposite sex." Women who completed ACASI in Spanish (95%) were more likely than other women (82%) to say they are attracted "only to the opposite sex."
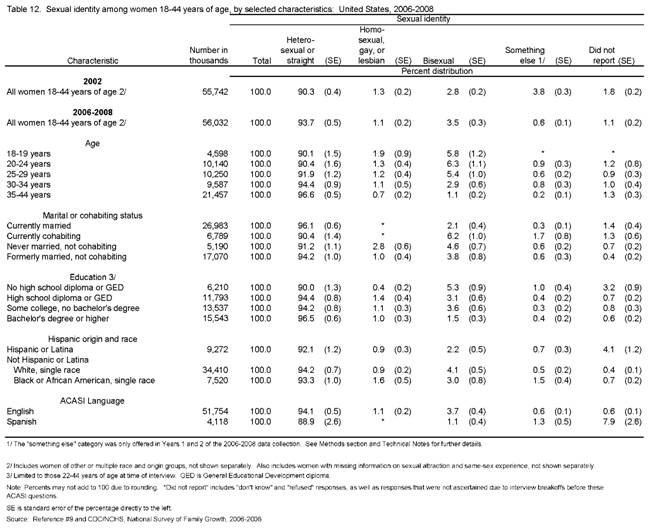
In both tables 12 and 13, the distribution by sexual identity reported by women and men
18-44 in 2006-2008 was similar to that seen in 2002. The primary change from 2002 in the distribution by sexual identity relates to the significantly lower percentages reporting "something else." As described in the Methods section of this report and in the Technical Notes, the decrease in reporting of "something else" is mainly attributable to the addition of clearer terms in the response categories for the 2006-2008 NSFG's question on sexual identity. Those fewer
cases in the 2006-2008 NSFG who reported their sexual identity as "something else" were asked a follow-up question, as described in the Methods section. Based on what the respondents typed into the computer, 37 of 87 women and 20 of 39 men who reported "something else" were unambiguously classified into one of the pre-existing categories of heterosexual, homosexual, and "don't know." As shown in the Technical Notes, this re-classification or "back-coding" did not significantly alter the overall distribution by sexual identify for adults 18-44 in the 20062008 NSFG. In addition, the percentages did not change from 2002 to 2006-2008 for those who responded "don't know" or "refused," which are labeled in tables 12 and 13 as "did not report." The question wording change, along with small amount of back-coding, also appears to have resulted in an increase in the percentages reporting "heterosexual or straight" - 94% of women in 2006-2008 compared with 90% in 2002, and 96% of men in 2006-2008 compared with 90% in
2002.
Age appeared more closely associated with sexual identity for women than for men. Women at the older end of the 18-44 age range were more likely to report themselves as heterosexual and less likely to report themselves as bisexual. Among men 18-44, no such pattern was seen. Looking at marital or cohabiting status, which is itself correlated strongly with age, 2.1% of currently married women and 0.4% of currently married men report themselves as bisexual. Among current cohabitors, 6.2% of women and 0.5% of men report themselves as bisexual. Among those men and women aged 18-44 who have never married, and are not cohabiting, 2.8% of women and 4.4% of men report themselves as homosexual; 4.6% of never married women and 2.1% of never married men report themselves as bisexual.
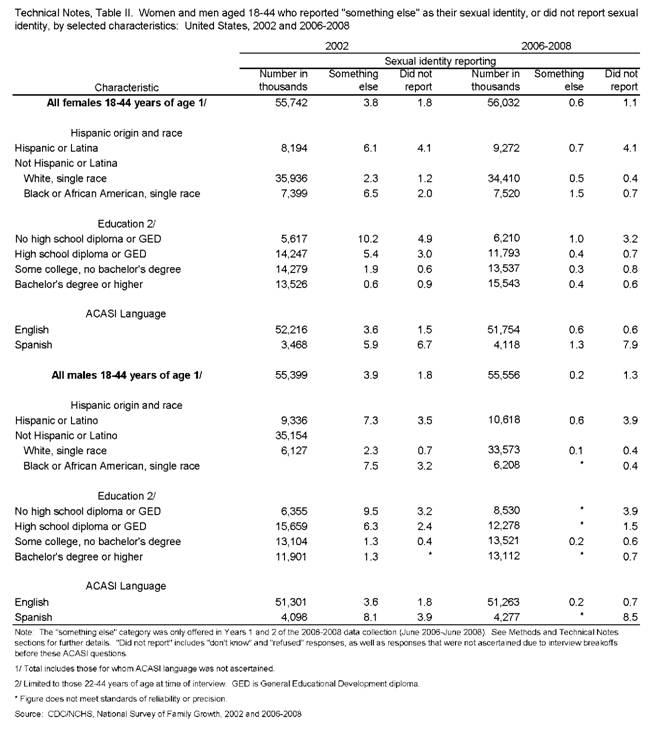
As in table 11 on sexual attraction, tables 12 and 13 show sexual identity tabulated by education, Hispanic origin and race, and the language in which ACASI was conducted. For women and men 22-44, those with less than a high school diploma were more likely (3.2% of women and 3.9% of men) to say "don't know" or "refused" (i.e., "did not report") on sexual identity than those with at least a high school education. With respect to race and Hispanic origin, Hispanic women (4.1%) and men (3.9%) were more likely not report sexual identity than those in other race/origin groups shown. Some evidence of a language barrier was suggested by the fact that 7.9% of women and 8.5% of men who completed ACASI in Spanish did not report sexual identity, compared with less than 1% of men and women who completed it in English.
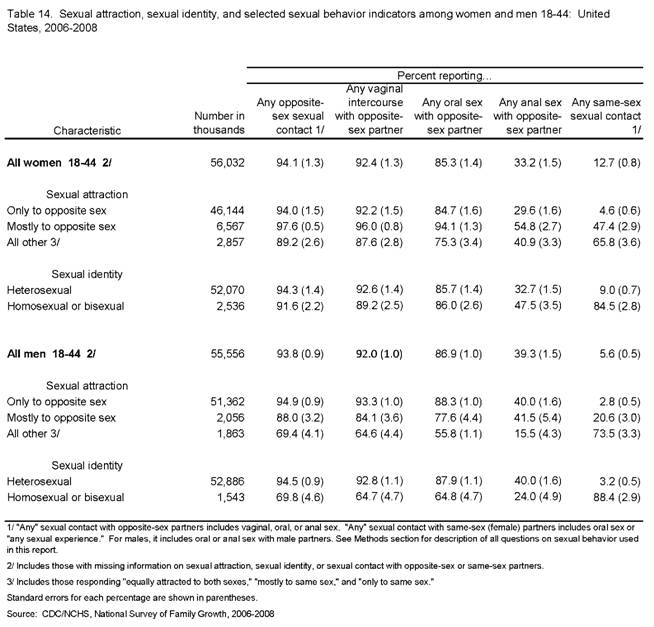
Association of sexual behavior, sexual attraction, and sexual identity (tables 14-15):
Table 14 presents percentages of women and men aged 18-44 who reported different types of sexual activity with opposite-sex and same-sex partners, according their sexual attraction and sexual identity. These figures show the extent to which sexual attraction and identity correlate with reports of sexual behavior, with both opposite-sex and same-sex partners. Women who said they are "mostly attracted to the opposite sex" (55%) rather than "only attracted to the opposite-sex" (30%) were more likely to have had anal sex with an opposite-sex partner. Women "mostly attracted to the opposite sex" (47%) were also more likely than women "only attracted to the opposite-sex" (5%) to have had any same-sex sexual experience with a female partner. Among men, no such difference was seen by sexual attraction for anal sex with opposite-sex partners, but those who were "mostly attracted to the opposite sex" were more likely to have ever had same-sex sexual contact with a male partner (21%) compared with men who were "only attracted to the opposite sex" (3%). Among those men and women who self-identify as heterosexual, 9% of women and 3.2% of men have ever had same-sex sexual
experience. Conversely, among those who report themselves as homosexual or bisexual, 15% of women (100% minus 85%) and 12% of men have never had same-sex sexual experience. A higher percentage (92%) of homosexual or bisexual women have ever had an opposite-sex sexual partner, compared with 70% of homosexual or bisexual men who have had such experience.
Looking at specific types of sexual experience with opposite-sex partners, some interesting differentials were seen. Close to one-third of heterosexual women have ever had anal sex with an opposite-sex partner, compared with 48% of homosexual or bisexual women. In contrast, anal sex with an opposite-sex partner was more likely to be reported by heterosexual men (40%) compared with homosexual or bisexual men (24%). For oral sex with an opposite-sex partner, no difference was seen by sexual identity for women, but for men, those who reported themselves as homosexual or bisexual (65%) were less likely than heterosexual men (88%) to have ever had oral sex with an opposite-sex partner.
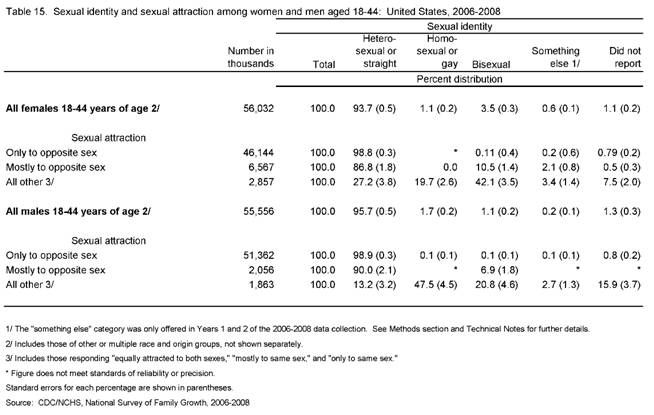
Table 15 shows the association of sexual attraction and sexual identity among adults 1844. Nearly all (99%) women and men who reported being attracted only to the opposite sex gave their sexual identity as heterosexual or straight. Among those attracted mostly to the opposite sex, 87% of women and 90% of men were heterosexual or straight. Due to small sample sizes, all other categories of sexual attraction were collapsed, including those who were equally attracted to both sexes, mostly attracted to the same sex, and only attracted to the same sex. This group labeled "all other" showed a different distribution by sexual identity for women and men. Women in the "all other" group were twice as likely as men to report themselves as bisexual (42% compared with 21%) or heterosexual (27% compared with 13%). Men in the "all other" group for sexual attraction were twice (16%) as likely as women (7.5%) not to report their sexual identity. These results suggest that these measures of sexual attraction and identity are closely associated but not identical and that different patterns of association may exist for women and men.
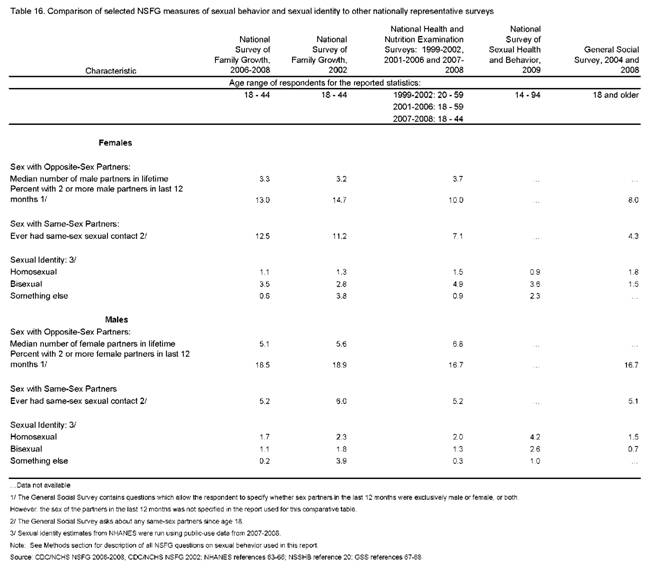
Comparisons with other data (table 16):
Table 16 compares 2006-2008 NSFG data on number of opposite-sex partners, same-sex sexual experience in lifetime, and sexual identity from the NSFG 2006-2008 with data from the 2002 NSFG, the National Health and Nutrition Examination Surveys (NHANES) 1999-2002, 2007-2008 and 2001-2006, the 2009 National Survey of Sexual Health and Behavior (NSSHB), and the 2004 and 2008 General Social Surveys (GSS). Age ranges for the statistics presented are shown in the table. For NHANES, data on sexual behavior and identity are from three sources. Published data on opposite-sex partners were available for 1999-2002 (63), and two recent articles show the prevalence of same-sex behavior for males and females using 2001-2006 data (64-65). Weighted frequencies of sexual identity based on the NHANES 2007-2008 public-use data were also included in the table (66). Similarly, information on sexual identity was first collected in the 2008 General Social Survey (67), and other data on sex and number of partners are from a published report using the 2004 General Social Survey (68). The comparisons between the NSFG and these other surveys are not always direct because the surveys were conducted in different years and their age ranges, question wording and response rates differ. Therefore, differences among these surveys do not always reflect trends or differences in behavior; they may reflect, at least in part, sampling error and differences in survey questions or procedures.
Despite those potential limitations, the survey results are fairly similar across several of these indicators of sexual behavior. The median number of opposite-sex partners in lifetime for males ranges between 5-7 partners, and 3-4 opposite-sex partners in lifetime among females. About 17 to 19 percent of males had 2 or more female partners in the last 12 months, compared to 8 to 15 percent of females who had 2 or more male partners. About 4-6 percent of males ever had same-sex contact. For females, the percent who have ever had same-sex contact ranges from about 4 percent in the GSS, to 11-12 percent in the 2002 and 2006-2008 NSFG. The percent reporting their sexual identity as homosexual ranged from 2-4 percent of males, and about 1-2 percent of females. The percent reporting their sexual identity as bisexual is between 1-3 percent of males, and 2-5 percent of females. As was described earlier, the proportion reporting "something else" was significantly lower in the 2006-2008 NSFG than in the 2002 NSFG due in part to question wording changes that were made in the 2006-2008 NSFG (also see Technical Notes).
Conclusion
This report was intended to provide updated national estimates of some basic statistics related to certain types of sexual behavior, attraction, and identity for men and women 15-44 years of age in the household population of the United States, in order to (a) measure the populations at risk of STI's and (b) to provide insights about factors related to birth and pregnancy rates. The results presented here are on a large national sample (n = 13,495), interviewed in person with the most reliable self-administered technique, and a good response rate (75%). The results reported here are generally similar to those in our report based on the 2002 NSFG (9). But the current report also presented improved NSFG measures for sexual identity, female-female sexual activity, and the relative timing of first vaginal and oral sex among those 15-24 years of age. Further, more detailed subgroup analyses will be possible when the next report is released, in about a year, with a national sample of over 22,000 men and women. The current report does, however, have significant limitations: the results are national, not state, estimates, and they are limited to the household population of the United States, ages 15-44. They do not cover persons who are currently homeless, incarcerated, living on military bases, or persons under age 15 or above age 44. Nevertheless, the data should prove useful for planning programs to prevent the spread of sexually transmitted infections and to prevent unintended pregnancy among men and women aged 15-44 in the United States.
References
1) Centers for Disease Control and Prevention. HIV Surveillance Report, 2008; vol. 20. 2010. Available at: http://www.cdc.gov/hiv/topics/surveillance/resources/reports/
2) Weinstock H, Berman S, Cates Jr., W. Sexually Transmitted Diseases Among American Youth: Incidence and Prevalence Estimates, 2000. Perspectives on Sexual and Reproductive Health 36 (1): 6-10. 2004.
3) Ventura SJ, Abma JC, Mosher WD, Henshaw SK. Estimated Pregnancy Rates for the United States, 19902005: An Update. NVSR Volume 58, Number 4. 15 pp. (PHS) 2010-1120. 2009.
4) Chesson HW, Blandford JM Gift TL, Tao G and Irwin KL. The Estimated Direct Medical Cost of Sexually Transmitted Diseases Among American Youth, 2000. Perspectives on Sexual and Reproductive Health 36 (1):
11-19. 2004.
5) Centers for Disease Control and Prevention. Sexually Transmitted Disease Surveillance, 2008. Atlanta, GA: U.S. Department of Health and Human Services. 2009.
6) Hall HI, Song R, Rhodes P, Prejean J, An Q, et al. Estimation of HIV incidence in the United States. JAMA
300(5): 520-529. 2008.
7) Bhaskaran K, Hamouda O, Sannes M, et al, and CASCADE Collaboration. Changes in the risk of death after HIV seroconversion compared with mortality in the general population. JAMA. 2008;300:51-59.
8) Gebo KA, Fleishman JA, Conviser R, Hellinger J, Hellinger FJ, et al. Contemporary costs of HIV healthcare in the HAART era. AIDS. 24: 2705-2715. 2010.
9) Mosher WD, Chandra A, Jones J. Sexual Behavior and Selected Health Measures: Men and Women 15-44 Years of Age, United States, 2002. Advance Data from Vital and Health Statistics; no 362. Hyattsville, MD: National Center for Health Statistics. 2005.
10) Billy JOG, Tanfer K, Grady WR, Klepinger DH. The Sexual Behavior of Men in the United States. Family Planning Perspectives 25 (2): 52-60. 1993.
11) Leigh BC, Temple MT, Trocki KF. The Sexual Behavior of US Adults: Results from a National Survey. American Journal of Public Health 83 (10): 1400-1408. 1993.
12) Laumann EO, Gagnon JH, Michael RT, Michaels S. The Social Organization Sexuality: Sexual Practices in the United States. Chicago: University of Chicago Press. 1994.
13) Michael RT, Gagnon JH, Laumann EO, Kolata G. Sex in America: A Definitive Survey. Boston: Little, Brown and Company. 1994.
14) Smith TW. "Sexual Behavior in the United States" in Sex and Sexuality: Sexuality Today: Trends and Controversies McAnulty, Richard D. Ed. New York, NY: Praeger Publishers. 104-132. 2006.
15) Anderson JE, Stall R. Increased Reporting of Male-to-Male Sexual Activity in a National Survey. Sexually Transmitted Diseases 29 (11): 643-646, November, 2002.
16) Rogers SM, Turner CF. Male-Male Sexual Contact in the USA: Findings from Five Sample Surveys, 19701990. Journal of Sex Research 28 (4): 491-519. 1991.
17) Turner CF, Villarroel MA, Chromy JR, Eggleston E, Rogers SM. Same-Gender Sex among U.S Adults: Trends Across the Twentieth Century and During the 1990's. Public Opinion Quarterly. 69(3): 439-462. 2005.
18) Centers for Disease Control and Prevention. Youth Risk Factor Behavior Surveillance—United States, 2009. Surveillance Summaries. June 4, 2010. MMWR. 59(SS-5). 2010.
19) Abma JC, Sonenstein FL. Sexual Activity and Contraceptive Practices among Teenagers in the United States, 1988 and 1995. Vital and Health Statistics, Series 23, No. 21. Hyattsville, MD: National Center for Health
Statistics. 2001.
20) Indiana University. Center for Health Promotion. Findings from the National Survey of Sexual Health and Behavior. Journal of Sexual Medicine. Vol 7: Supp 5. 2010.
21) Groves RM, Mosher WD, Lepkowski J, Kirgis NG. Planning and development of the continuous National Survey of Family Growth. National Center for Health Statistics. Vital Health Stat 1(48). 2009.
22) Lepkowski JM, Mosher WD, Davis KE, Groves RM, Van Hoewyk J. The 2006-2010 National Survey of Family Growth: Sample design and analysis of a continuous survey. National Center for Health Statistics. Vital Health Stat 2(150). 2010.
23) Abma JC, Martinez GM, Copen CE. Teenagers in the United States: Sexual Activity, Contraceptive Use, and Childbearing, National Survey of Family Growth 2006-2008. National Center for Health Statistics. Vital Health Stat 23 (30). 2010.
24) Mosher WD, Jones J. Use of Contraception in the United States: 1982-2008. National Center for Health Statistics. Vital Health Stat 23(29). 2010.
25) Anderson, JE, Chandra, A, Mosher, WD. HIV Testing in the United States, 2002. Advance Data from Vital and Health Statistics: no. 363. Hyattsville, MD. National Center for Health Statistics, 2005.
26) Anderson, JE, Mosher, WD, Chandra, A. Measuring HIV Risk in the U.S Population Aged 15-44: Results from Cycle 6 of the National Survey of Family Growth. Advance Data from Vital and Health Statistics; no 377. Hyattsville, MD: National Center for Health Statistics. 2006.
27) Turner CF, Miller HG, Moses LE. AIDS: Sexual Behavior and Intravenous Drug Use. National Research Council, National Academy of Sciences. Washington, DC: National Academy Press. 1989.
28) Miller HG, Turner CF, Moses LE. AIDS: The Second Decade. National Research Council, National Academy of Sciences. Washington, DC: National Academy Press. 1990.
29) Sell RL, JB Becker. Sexual Orientation Data Collection and Progress Toward Healthy People 2010. American Journal of Public Health 91 (6): 876-882. 2001.
30) Turner C, Ku L, Rogers S, Lindberg L, Pleck J, Sonenstein F. Adolescent Sexual Behavior, Drug Use, and Violence: Increased Reporting with Computer Survey Technology. Science 280: 867-873. 1998.
31) Chandra A, Martinez GM, Mosher WD, Abma JC, Jones J. Fertility, family planning, and reproductive health of US women: Data from the 2002 National Survey of Family Growth. Vital Health Stat 23(25). Hyattsville,
MD: National Center for Health Statistics. 2005.
32) Martinez GM, Chandra A, Abma JC, Jones J, Mosher WD. Fertility, contraception, and fatherhood: Data on men and women from the 2002 National Survey of Family Growth. Vital Health Stat 23(26). Hyattsville, MD: National Center
for Health Statistics. 2006.
33) National Center for Health Statistics, 2006-2008 National Survey of Family Growth (NSFG) Public Use Files, User's Guide, May 2010. Hyattsville, MD: National Center for Health Statistics. Available from: http://www.cdc.gov/NCHS/data/nsfg/NSFG 2006-08 UserGuide MainText.pdf . May 2010.
34) National Center for Health Statistics, 2006-2008 NSFG ACASI Files, User's Guide. Hyattsville, MD: National Center for Health Statistics. Available from: http://www.cdc.gov/NCHS/nsfg.htm. March 2011.
35) Miller K. Cognitive testing of the NHANES sexual orientation questions. Hyattsville, MD: National Center for Health Statistics. Available from:
http://wwwn.cdc.gov/qbank/report/Miller_NCHS_2001NHANESSexualityReport.pdf. 2001.
36) Groves RM, Benson G, Mosher WD, Rosenbaum, J, Granda P, Axinn W, Lepkowski J, Chandra A (2005). Plan and operation of the 2002 National Survey of Family Growth. Vital and Health Statistics Series 1, No. 42.
Hyattsville, MD: National Center for Health Statistics. 2005.
37) Martinez GM, Marin BV, Schoua-Glusberg A. Translating from English to Spanish: The 2002 National Survey of Family Growth. Hispanic Journal of Behavioral Sciences 28(4):531-545. 2006.
38) Aral SO, Padian NS, Holmes KK. Advances in Multilevel Approaches to Understanding the Epidemiology and Prevention of Sexually Transmitted Diseases Infections and HIV: An Overview. The Journal of Infectious
Diseases. 191(1): S1-S6. 2005.
39) Adimora AA, Schoenbach VJ, Doherty IA. Concurrent Sexual Partnerships Among Men in the United States.
Am J Public Health 97(12): 2230-2237. 2007.
40) Adimora AA, Schoenbach VJ, Taylor EM, Khan MR, Schwartz RJ. Concurrent Partnerships, Nonmonogamous Partners, and Substance Use Among Women in the United States. Am J Public Health. 2010. [Epub ahead of print]
41) Aral SO, Leichliter JS. Non-monogamy: risk factor for STI transmission and acquisition and determinant of STI spread in populations. Sex Transm Infect. 2010. [Epub ahead of print].
42) Leichliter JS, Chesson, HW & Sternberg, M et al. The Concentration of Sexual Behaviours in the USA: A Closer Examination of Subpopulations. Sex Transm Infect. 2010. [Epub ahead of print].
43) Ford CL, Whetten KD, Hall SA, Kaufman JS, Thrasher AD. Black Sexuality, Social Construction and Research Targeting 'The Down Low'. Annual Review of Epidemiology. 17: 209-216. 2007.
44) Hamilton, DT, Morris, M. Consistency of Self-Reported Sexual Behavior in Surveys. Arch Sex Behav. 39:
842-860. 2010.
45) McQuillan GM, Kruszon-Moran D, Granade T, Feldman JW. Seroprevalance of HIV in the US household population aged 18-49 years: The National Health and Nutrition Examination Surveys, 1999-2006. J Acquir
Immune Defic Syndr. 53(1): 117-123. 2010.
46) Datta DS, Sternberg M, Johnson RE, Berman S, Papp, JR, et al. Gonorrhea and Chlamydia in the United States among persons 14 to 30 years of age, 1999-2002. Ann Intern Med. 147(2): 89-96. 2007.
47) Dunne, EF, Unger, ER, Sternberg, M, McQuillan, G, Swan, DC, et al. Prevalence of HPV infection among
females in the United States. JAMA. 297(8): 813-819. 2007.
48) Markowitz LE, Sternberg M, Dunne EF, McQuillan G, Unger ER. Seroprevalence of human papillomavirus types 6, 11, 16, and 18 in the United States: National Health and Nutrtion Examination Survey 2003-2004. J
Infect Dis. 200: 1059-1067. 2009.
49) Sutton M, Sternberg M, Koumans EH, McQuillan G, Berman, et al. The prevalence of Trichomonas vaginalis infection among reproductive-age women in the United States, 2001-2004. Clinical Infectious Diseases. 45:
1319-1326. 2007.
50) Xu F, Sternberg MR, Kottiri BJ, McQuillan GM, Lee FK, et al. Trends in herpes simplex virus type 1 and type 2 seroprevalence in the United States. JAMA. 296(8): 964-973. 2006.
51) Edwards S, Carne C. Oral Sex and the Transmission of Non-Viral STIs. Sexually Transmitted Infections 74:
95-100. 1998.
52) Rothenberg RB, Scarlett M, del Rio C, Reznik D, O'Daniels C. Oral Transmission of HIV. Acquired Immune Deficiency Syndromes.12: 2095-2105. 1998.
53) Cherpes TL, Meyn LA, Hillier SL. Cunnilingus and vaginal intercourse are risk factors for herpes simples virus type 1 acquisition in women. Sex Transm Dis. 32(2): 84-89. 2005.
54) Baggaley, RF, White, RG, Boily, MC. Systematic review of orogenital HIV-1 transmission probabilities. International Journal of Epidemiology. 37(6): 1255-1265. 2008.
55) Halpern-Felsher BL, Cornell JL, Kropp RY, Tschann JM. Oral versus Vaginal Sex among Adolescents: Perceptions, Attitudes, and Behavior. Pediatrics 115:845-851. 2005.
56) Schuster MA, Bell RM, Kanouse DE. The Sexual Practices of Adolescent Virgins: Genital Sexual Activities of High School Students who Have Never Had Vaginal Intercourse. American Journal of Public Health 86 (11): 1570-1576. 1996.
57) Brewster KL, Tillman KH. Who's Doing it? Patterns and Predictors of Youths' Oral Sexual Experiences. Journal of Adolescent Health. 42: 73-80. 2008.
58) Lindberg LD, Jones R, Santelli JS. Noncoital Sexual Activities Among Adolescents. Journal of Adolescent
Health. 43: 231-238. 2008.
59) Uecker JE, Angotti N, Regnerus MD. Going most of the way: "Technical virginity" among American adolescents. Social Science Research. 37: 1200-1215. 2008.
60) Song, AV, Halpern-Felsher, BL. Predictive Relationship Between Adolescent Oral and Vaginal Sex. Archives of Pediatrics and Adolescent Medicine. [Epub ahead of print] E1 - E7. 2010.
61) American College of Obstetricians and Gynecologists. Addressing health risks of noncoital sexual activity. ACOG Committee Opinion No. 417. Obstetrics & Gynecology. 112:735-7. 2008.
62) Pathela P, Schillinger JA. Sexual Behaviors and Sexual Violence: Adolescents with Opposite-, Same-, or Both-
Sex Partners. Pediatrics. 126(5): 879-886. 2010.
63) Fryer, CD, Hirsch, R, Porter, KS et al. "Drug Use and Sexual Behaviors Reported by Adults: United States,
1999-2002". Advance Data. Vital Health Stat. no. 384. 2007.
64) Xu, F, Sternberg, MR, Markowitz, LE. Men who have sex with men in the United States: Demographic and Behavioral Characteristics and Prevalence of HIV and HSV-2 Infection. Sexually Transmitted Diseases. 37(6):
399-405. 2010.
65) Xu, F, Sternberg, MR, Markowitz, LE. Women who have sex with women in the United Statates: Prevalence, Sexual Behavior and Prevalence of Herpes Simplex Virus Type 2 Infection. Sexually Transmitted Diseases.
37(7): 407-413. 2010.
66) CDC/National Center for Health Statistics, National Health and Nutrition Examination Survey (2007-2008). Available at: http ://www. cdc. gov/nchs/nhane s. htm
67) Gates, GJ. Sexual Minorities in the 2008 General Social Survey: Coming out and Demographic Characteristics. The Williams Institute. 2010. Accessed online at: http://www.law.ucla.edu/williamsinstitute/pdf/Sexual-
68) Smith, TW. American Sexual Behavior: Trends, Socio-Demographic Differences and Risk Behavior. National Opinion Research Center. GSS Topical Report. No. 25. Updated March 2006.
Technical Notes on the NSFG's Measurement of Sexual Identity
Basic information on the NSFG's measurement of sexual identity was provided in the Methods section. Below, further detail is provided on the changes made to the sexual identity question since the 2002 NSFG and the effects these changes have had on the results. In 2002 and 2006-2008 of the NSFG, the question on sexual identity directly followed the sexual attraction question in ACASI, and both of these items followed all ACASI questions on sexual behavior with opposite-sex and same-sex partners. In 2002, the sexual identity question was worded as follows, for both males and females:
"Do you think of yourself as ...
Heterosexual
Homosexual
Bisexual
Or something else?"
As shown in tables 12 and 13 of the report based on 2002 NSFG data (8), 3.8% of females 18-44 and 3.9% of males 18-44 reported "something else." For some population groups, such as Hispanic and non-Hispanic black persons, the percentages reporting "something else" were higher than the percentages reporting "homosexual" or "bisexual." In order to understand and potentially reduce the percentages reporting "something else," two changes were made to the sexual identity question at the start of interviewing for the 2006-2008 NSFG:
1. More commonly known terms for sexual identity were added to the response categories. Instead of "heterosexual," the response was changed to "heterosexual or straight" for both men and women. Instead of "homosexual," men were offered "homosexual or gay," and women were offered "homosexual, gay, or lesbian."
2. Those who reported "something else" were asked a follow-up question: "When you say something else, what do you mean? Please type in your answer." The verbatim text they typed in was reviewed by NSFG staff and coded, where possible and unambiguous, into the pre-existing categories.
Based on analyses with the 2006-2008 NSFG data, the first change had by far the larger impact on reporting of "something else." Table I shows that even before the verbatim responses were examined for "something else" responses, the unweighted numbers and the weighted percentages reporting "something else" were significantly smaller than those found with the 2002 NSFG. In 2002, there were 294 women 18-44 and 175 men 18-44 who responded "something else," and as was noted earlier, these unweighted numbers represented nearly 4% (weighted) of men and women aged 18-44 in 2002. Meanwhile, in the 2006-2008 NSFG, many fewer men and women 18-44 originally reported "something else" - 87 women and 39 men, yielding weighted percentages of 1.0% of women and 0.7% of women aged 18-44. After the verbatim responses were examined from the follow-up question, 37 of 87 women and 20 of 39 men provided information that could readily classify them into one of the provided categories (i.e., the responses were able to be backcoded). This backcoding was done conservatively, only editing responses that used words expressly contained in the provided response categories such as "straight" or "gay," or responses that directly stated the respondent's sexual preference such
as men saying "I only like women" and women saying "I only like men." Among the 50 women and 19 men whose verbatim responses yielded no codable information, a few had entered only blank spaces, presumably to get past the question, and the remainder gave ambiguous or unrelated comments that could not be used to code sexual identity. Table I also shows the full distribution of sexual identity before and after the backcoding of 37 women and 20 men; no significant change was seen in any of the categories shown.
To describe the net effects of both of these question changes on the reporting of sexual identity, table II shows the percentages reporting "something else" in the 2002 and 2006-2008 NSFG. Also shown are percentages that "did not report" sexual identity, a category which consists of those who responded "don't know" or "refused" and those who terminated their ACASI interviews before the sexual identity question. Given the differentials seen in the percentages reporting "something else" by Hispanic origin and race in 2002 and 2006-2008, the percentages are also shown by educational attainment and ACASI language. While no significant difference was seen in the "did not report" percentages between 2002 and 2006-2008, table II documents that the overall reduction in "something else" reporting for all men and women aged 18-44 was mirrored in every subgroup shown. For Hispanic origin and race, the 2002 data had shown significantly higher levels of "something else" for Hispanic and non-Hispanic black men and women, relative to non-Hispanic white women and men. Those differentials were no longer seen in 2006-2008 for reports of "something else," but instead Hispanic women (4.1%) and men (3.9%) were more likely not to report sexual identity than the other race and origin groups.
To address concerns that language barriers or educational attainment may impact reporting of "something else" on sexual identity or increase the chances of nonresponse, table II shows these percentages by educational attainment and the language in which ACASI was conducted. In most education groups shown, the levels of both "something else" and "did not report" fell in 2006-2008 for both women and men aged 22-44. Women (3.2%) and men (3.9%) with less than a high school education continued to show higher percentages not reporting sexual identity than those in other education groups. In both 2002 and 2006-2008, those completing ACASI in Spanish were significantly more likely not to report sexual identity. For example, nearly 8% of women 18-44 in 2006-2008 who completed ACASI in Spanish did not report sexual identity, compared with 0.6% of women who completed it in English. For percentages reporting "something else" on sexual identity, the differentials by ACASI language were more striking in 2002 (for example, 8.1% of men completing it in Spanish compared with 3.6% of men completing it in English) than in 2006-2008, but given the significant reduction overall in the numbers and percentages responding "something else" in 2006-2008, the ACASI language variable no longer shows a significant association.
In summary, the changes made to the sexual identity question between the 2002 NSFG and the 2006-2008 NSFG appear to have had a significant impact on the percentages reporting "something else" as well as on the percentages who "did not report" sexual identity. The majority of reduction in "something else" reporting since the 2002 NSFG is attributable to the addition of several commonly known terms to the heterosexual and homosexual response categories for the 2006-2008 NSFG. While some backcoding was done based on the "something else" follow-up question's verbatim responses, this affected a fairly small fraction of cases in the overall 2006-2008 NSFG sample because less than 1% of men and women aged 18-44 originally reported "something else," and did not significantly alter the overall distribution by sexual identity. As a result of the significantly reduced levels of "something else" reporting in 2006-
2008 and the survey costs associated with the follow-up question, the "something else" response option and follow-up question were deleted beginning in July 2008, Year 3 of the 2006-2010 NSFG.
Acknowledgements
The 2006-2008 National Survey of Family Growth (NSFG) was conducted by the National Center for Health Statistics (NCHS) with the support and assistance of a number of other organizations and individuals. Interviewing and other tasks were carried out by the University of Michigan's Survey Research Center, Institute for Social Research, under a contract with NCHS. The 2006-2008 NSFG was jointly planned and funded by the following programs and agencies of the U.S. Departments of Health and Human Services:
• The Eunice Kennedy Shriver National Institute for Child Health and Human Development
• The Office of Population Affairs
• The CDC's National Center for Health Statistics
• The CDC's National Center for HIV, STD, and TB Prevention
• The CDC's Division of Reproductive Health
• The CDC's Office of Women's Health
• The Office of Planning, Research, and Evaluation of the Administration for Children and Families (ACF); the Children's Bureau of the ACF
• The Office of the Assistant Secretary for Planning and Evaluation (OASPE)
NCHS gratefully acknowledges the contributions of these programs and agencies, and all others who assisted in designing and carrying out the NSFG.
This report was prepared under the general direction of Charles J. Rothwell, Director of NCHS's Division of Vital Statistics (DVS), and Stephanie J. Ventura, Chief of the Reproductive Statistics Branch of DVS. The authors are also grateful for the valuable comments provided by Stephanie Ventura, Julia Holmes, DVS Associate Director for Science, and Jennifer Madans, NCHS Associate Director for Science. We also thank Yashodhara Patel, Jo Jones, and Veena Billioux for their helpful contributions to the preparation of this report.
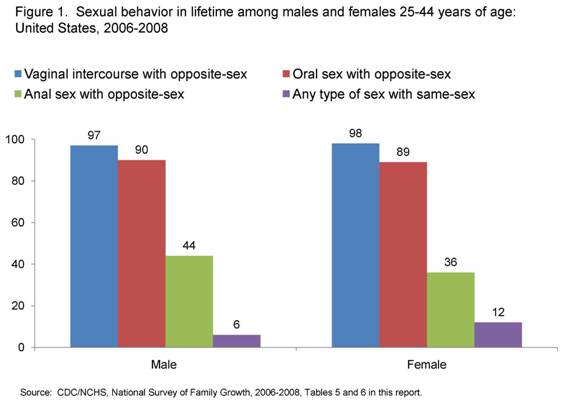
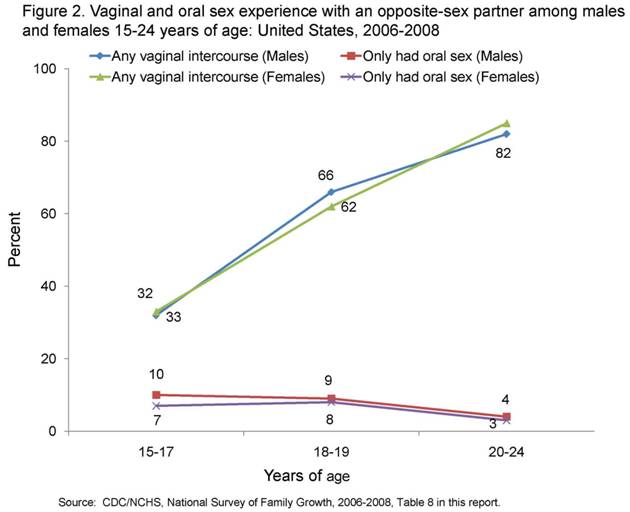
|
Table A. Percent who had first oral sex before first vaginal intercourse among males and females aged 15-24 who ever had oral sex, by selected characteristics: United States 2007-2008 |
||||
|
Characteristic |
Number in thousands |
Percent who had first oral sex before first vaginal intercourse 1/ |
(standard error) |
|
|
All persons aged 15-24 who ever had oral sex 2/ |
27,266 |
|
50.9 |
(2.05) |
|
Sex Male Female |
13,384 13,883 |
|
49.8 51.9 |
(2.29) (3.32) |
|
Age at first vaginal intercourse 17 years or younger 18-19 years 20-24 years |
18,423 4,396 1,577 |
|
41.4 56.0 70.1 |
(2.35) (4.25) (5.70) |
|
Hispanic origin and race Hispanic or Latino/a Not Hispanic or Latino/a White, single race Black or African American, single race |
4,679 17,319 3,772 |
|
39.0 56.6 39.4 |
(4.91) (2.17) (4.24) |
|
1/ The question on the timing of oral sex relative to vaginal intercourse was asked starting in 2007. Those who never had vaginal intercourse but have had oral sex are classified as having had oral sex before vaginal intercourse. 2/ Includes those of other or multiple race and origin groups, not shown separately. Source: CDC/NCHS, National Survey of Family Growth, 2006-2008 |
||||